16 April 2023
459 times
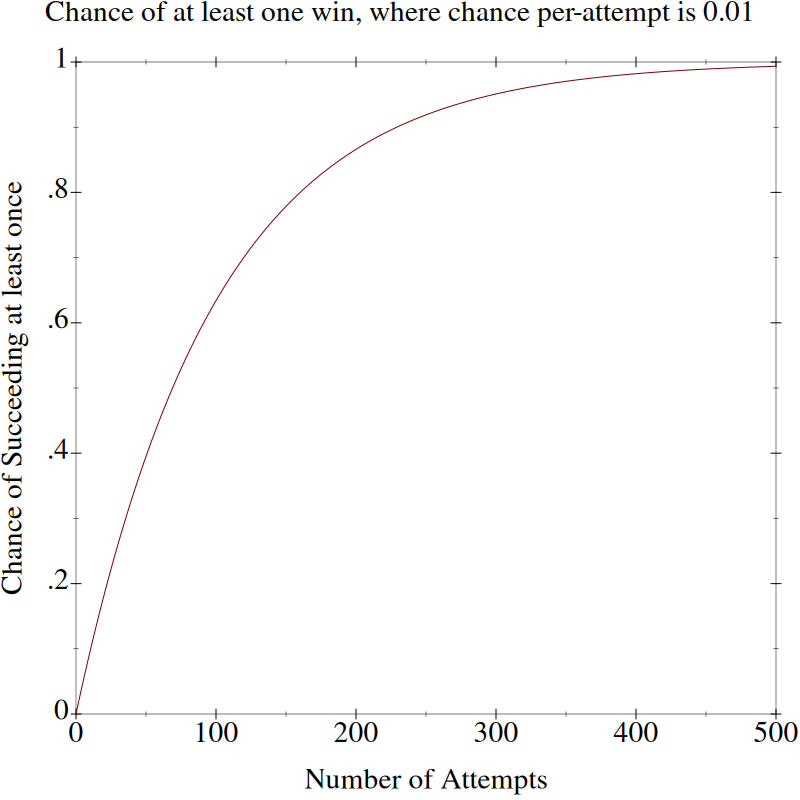
If you have a 99% chance of failure, for a given task, then if you attempt it 459 times, your chance of success will be over 99%.
It gets better than this - after only 69 attempts, your chance of success is already greater than 50%.
If we plot this out, we can see that even if your chance of success each time is only 1%, it doesn't take that many attempts to start to have a significant chance of success.
Get climbing that curve!
Graph Code [Show]
Created with a little bit of Racket.#lang racket
(require plot)
(define (f x) (- 1 (expt 0.99 x)))
(plot-title "Chance of at least one win, where chance per-attempt is 0.01")
(plot-width 800)
(plot-height 800)
(plot-x-label "Number of Attempts")
(plot-y-label "Chance of Succeeding at least once")
(plot-font-size 22)
(plot (function f 0 500 #:y-max 1 #:y-min 0))